GeoJSON = JSONベースのGISデータ記述フォーマットで 地球上の緯度・経度のデータと、その配列から点・線・面を表現することができます。
* GISとはGeoJSONのような地理情報データをもとに可視化、分析するシステム Geographic Information System を指します。
地理情報データを座標値(ベクトル)と複数の属性で構成できるので、地球上のある場所(点)、2点間の距離や道路(線)、建物や土地(面)をデータとして表現できます。
点を表現する
以下のような形式で表現します。
{
  type: 'Feature',
  properties: {
    name: 'yokohama station',
  },
  geometry: {
    type: 'Point',
    coordinates: [139.6221793, 35.4656302],
  },
}
GeoJSONは以下のような構造になっています
// Feature Object
{
  type: ...
  properties: {...}

  // Geometry Object
  {
    type: ...
    coordinates: [...]
  }
}
外側のFeature ObjectのtypeにはこのオブジェクトがFeatureであることを表すために指定するものです。
Featureは「地物」という意味で地理上の対象物を指しますが、「フィーチャー」と説明されている資料が多いので以降はそのままFeatureとします。 Featureオブジェクトは geometry / properties というメンバーを持たないといけないのでここにそれぞれ形状と任意の属性情報を定義します。ここで形状に関する定義を書いたのがGeometryオブジェクトと呼ばれるものになります。
Geometryはtypeが"Point" | "MultiPoint" | "LineString" | "MultiLineString" | "Polygon" | "MultiPolygon"のいずれかで、typeで指定した形状に合った座標データである coordinates属性を持つオブジェクトです。「点」なので
type: 'Point',
coordinates: [経度(longitude), 緯度(latitude)]"
を指定しています。
このGeoJSONを地図上に描画すると以下のようになります。
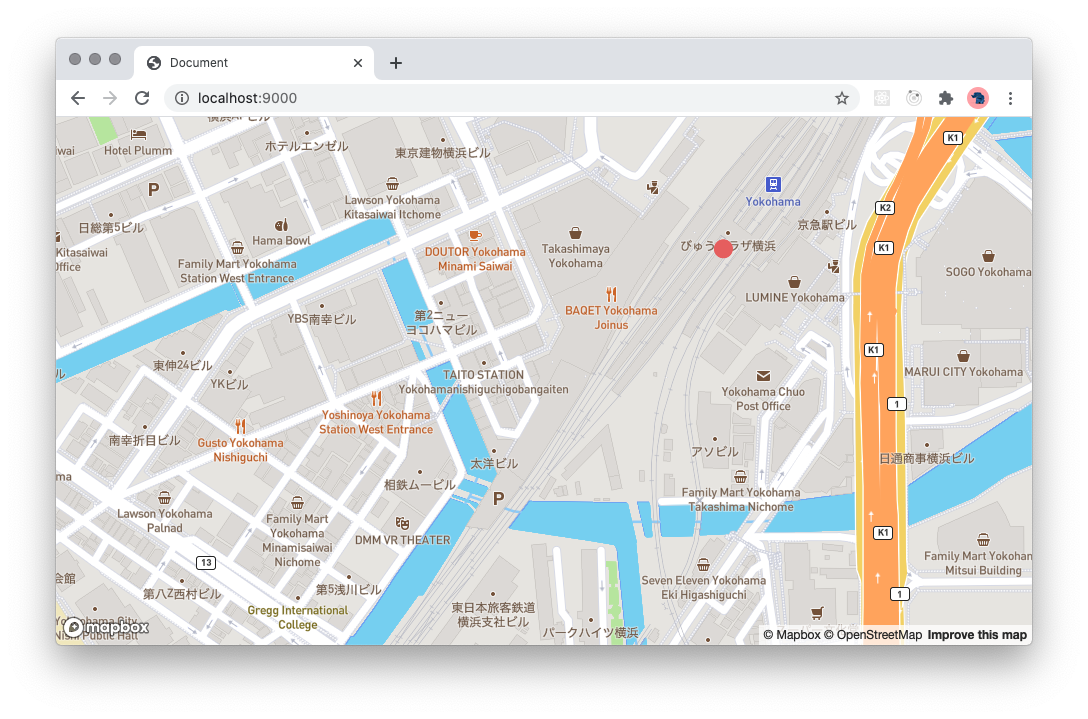
Mapboxを使うと以下のように書くことができました。
import * as MapBox from 'mapbox-gl'
const map = new MapBox.Map({
accessToken: process.env.MAPBOX_API_TOKEN,
style: 'mapbox://styles/mapbox/streets-v11',
container: 'map',
center: [139.6202541, 35.4644751],
zoom: 16,
})
const yokohama: GeoJSON.Feature = {
type: 'Feature',
properties: {
name: 'Yokohama st.',
},
geometry: {
type: 'Point',
coordinates: [139.6221793, 35.4656302],
},
}
const draw = () => {
map.addSource('yokohama', { type: 'geojson', data: yokohama })
map.addLayer({
id: 'yokohama',
type: 'circle',
source: 'yokohama',
paint: {
'circle-color': '#e55e5e',
'circle-radius': 10,
},
})
}
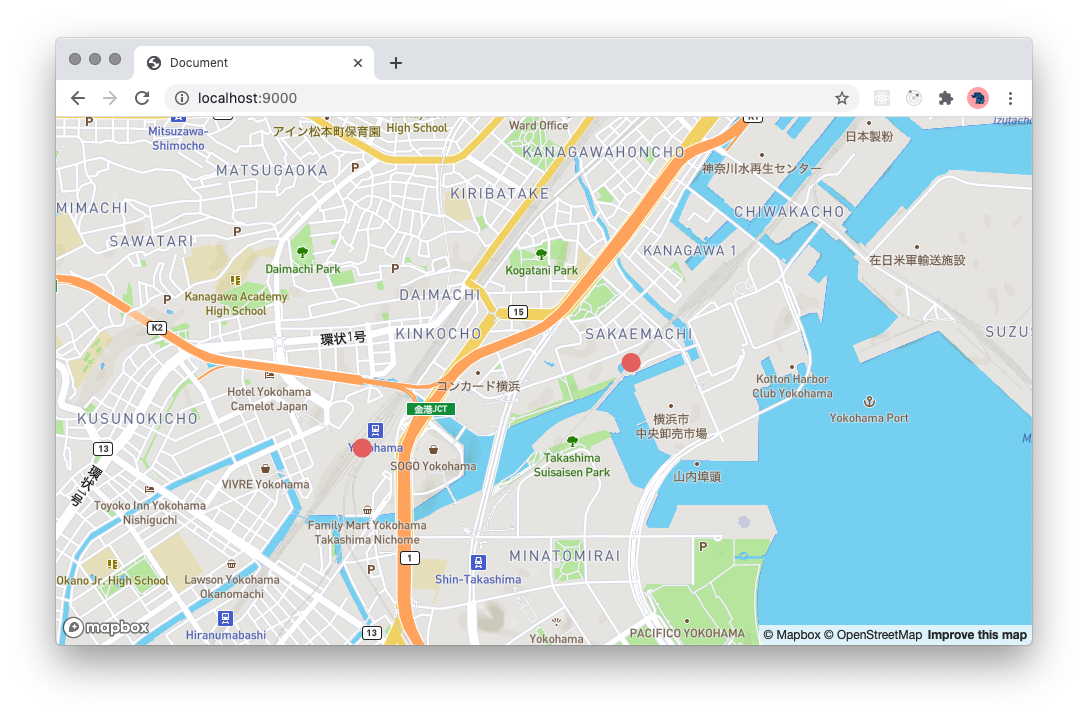
map.on('load', draw)同様にGeometryオブジェクトを MultiPointにすると複数点を打つことができます。
  ...
  geometry: {
    type: 'MultiPoint',
    coordinates: [
      [139.6221793, 35.4656302],
      [139.6329472, 35.4684187],
    ],
  },
  ...
線、面を表現する
Feature Objectの構造がわかれば、線・面もtypeとcoordinatesの指定によって表現することができます。今回はLineStringとPolygonの2つを表したいので、Featureの集まりを表現するFeatureCollectionという型を使うようにします。
const featureCollection: GeoJSON.FeatureCollection = {
type: 'FeatureCollection',
features: [
{
type: 'Feature',
properties: {},
geometry: {
type: 'LineString',
coordinates: [
[139.62401568889618, 35.46705338178199],
[139.62408542633057, 35.4670795960569],
[139.62411761283875, 35.467166976911514],
[139.62504029273984, 35.46659899965942],
[139.62577521800995, 35.46668201196964],
[139.62631165981293, 35.466349962214736],
[139.627046585083, 35.46710581032323],
[139.6271699666977, 35.46704901273534],
[139.62776005268097, 35.467180084031526],
[139.62835550308228, 35.467136393623186],
[139.62832868099213, 35.46724561959949],
[139.6283769607544, 35.46726309574195],
[139.62841987609863, 35.467180084031526],
[139.62836623191833, 35.467175714991754],
[139.62835550308228, 35.46730678608144],
[139.62843596935272, 35.46740727377218],
[139.62869882583618, 35.46752960644362],
[139.63274359703064, 35.468752922923414],
[139.63289245963097, 35.468663359312494],
[139.63299036026, 35.468735447104734],
],
},
},
{
type: 'Feature',
properties: {},
geometry: {
type: 'Polygon',
coordinates: [
[
[139.63301181793213, 35.468740908298464],
[139.63289514183998, 35.46864916019427],
[139.63293671607968, 35.4686251309116],
[139.63304668664932, 35.468720155760245],
[139.63301181793213, 35.468740908298464],
],
],
},
},
],
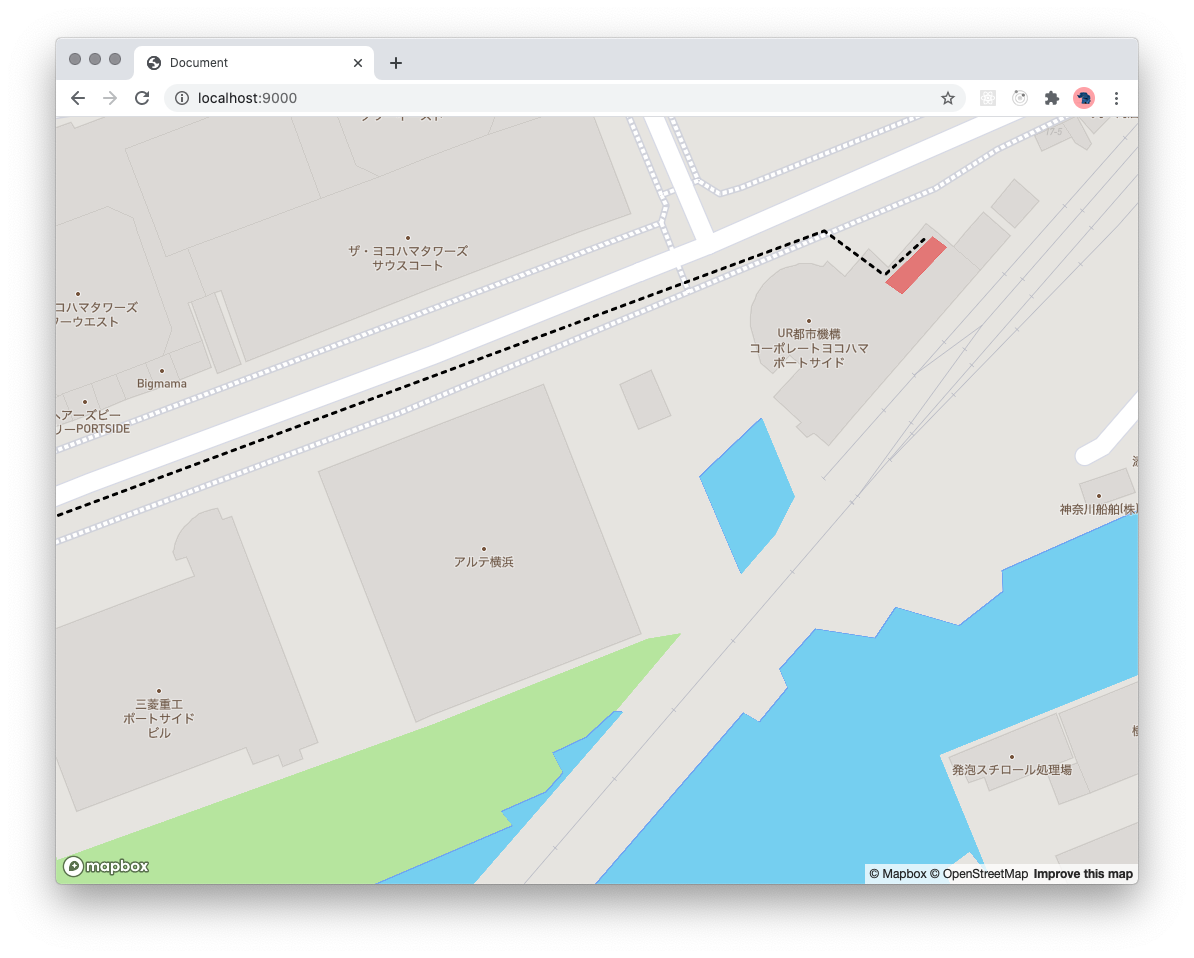
}Mapboxで以下のように描画できます。FeatureCollection、またはFeatureでGeometoryがGeometoryCollectionの場合、filterを指定して、Geometry毎にaddLayerする必要がある点に注意してください。
const draw = () => {
  map.addSource('feature-collection', {
    type: 'geojson',
    data: featureCollection,
  })

  map.addLayer({
    id: 'polygon',
    type: 'fill',
    source: 'feature-collection',
    filter: ['==', '$type', 'Polygon'],
    paint: {
      'fill-color': '#e55e5e',
      'fill-opacity': 0.8,
    },
  })

  map.addLayer({
    id: 'lines',
    type: 'line',
    source: 'feature-collection',
    filter: ['==', '$type', 'LineString'],
    layout: {
      'line-cap': 'round',
      'line-join': 'round',
    },
    paint: {
      'line-color': '#000',
      'line-width': 3,
      'line-dasharray': [1, 2],
    },
  })
}

map.on('load', draw)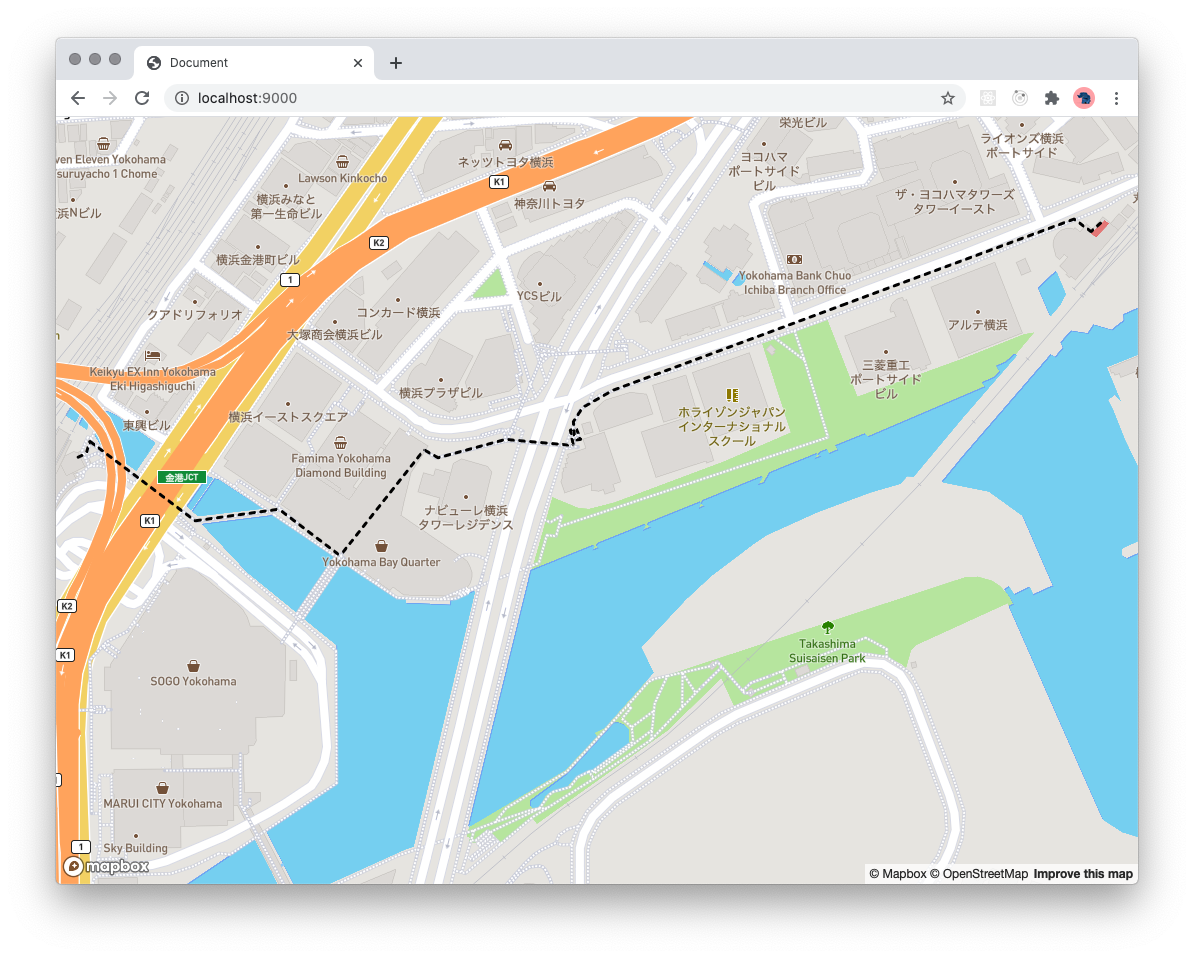
また、サンプルで使用したようなGeoJSONはMapbox StudioのDataset editorやgeojson.ioなどを使うとGUIで生成することができます。
Turf.js
よりインタラクティブなものを作る場合はあるFeatureから別のFeatureを計算したり、座標からFeatureを生成するといったことが必要です。 そこで使えるのがTurf.jsです - https://turfjs.org/
Turf.jsは地理情報の計算ユーティリティライブラリでGeoJSONで表された地理情報の各種計算や生成を行ってくれます。
例えばlineStringは座標のリストを与えるとLineStringをGeometryにもつFeatureオブジェクトを返します。alongはLineStringのFeatureと距離を与えると、線に沿って与えた距離の地点にあるPointを返してくれます。
const { along, lineString } = require('@turf/turf')

const line = lineString([
  [139.62401568889618, 35.46705338178199],
  [139.63299036026, 35.468735447104734]
])

along(line, 500, { units: 'meters' })
/**
{
  type: 'Feature',
  properties: {}
  geometry: {coordinates: [139.6293961042775, 35.46806188686572], type: "Point"}
}
*/alongを使って一定の間隔ごとに距離を更新すれば、LineString上を移動するPointを可視化できそうです。
import * as MapBox from 'mapbox-gl'
import { along, booleanEqual } from '@turf/turf'
import { point } from '@turf/helpers'
import { getCoord } from '@turf/invariant'


... 省略
const start = point(featureCollection.features[0].geometry.coordinates[0])
let tick = 0
let lastCoords = getCoord(start)

map.addSource('footPrint', { type: 'geojson', data: start })

map.addLayer({
  id: 'footPrint',
  type: 'circle',
  source: 'footPrint',
  paint: {
    'circle-color': '#e55e5e',
    'circle-radius': 10,
  },
})

const step = () => {
  const next = along(featureCollection.features[0], tick + 0.8, {
    units: 'meters',
  })
  map.getSource('footPrint').setData(next)
  const coords = getCoord(next)
  map.panTo(coords)

  if (booleanEqual(point(lastCoords), point(coords))) {
    return
  }

  tick += 1
  lastCoords = coords

  window.requestAnimationFrame(step)
}

window.requestAnimationFrame(step)
サンプル: https://epic-pike-91c472.netlify.app/
以下のサイトを参考させていただきました。